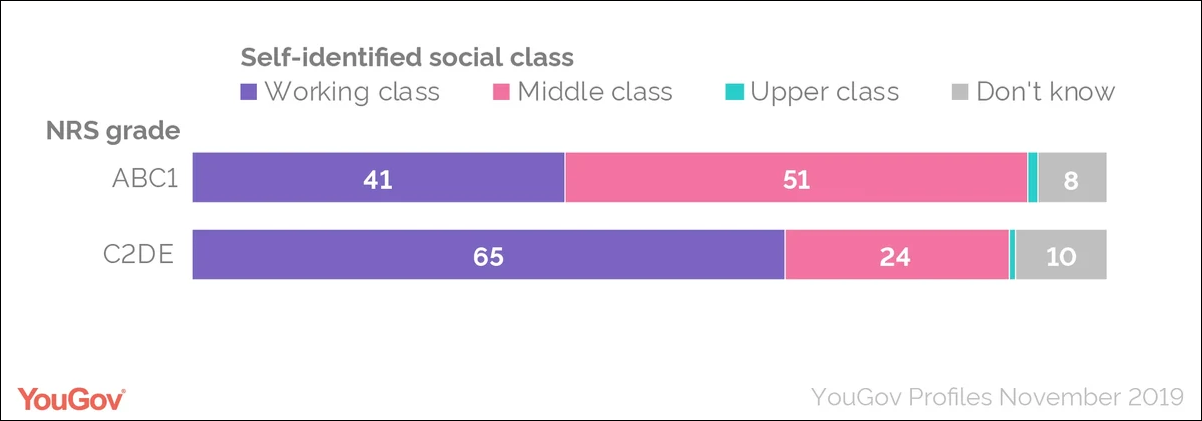
Our standard measure of social class was never designed to describe class – it was meant to describe occupation. ABC1 is the term for those who work in administrative or professional roles, and is now the common label for middle class, but only half of this group considers themselves to be so. Meanwhile two-thirds of C2DEs, those in manual work, believe themselves to be working class.

The proportion of transgender people in the UK is largely a function of language. In the 2021 census, those who spoke English “not well” or “not well at all” were most likely to be counted as transgender: 2.2% of them, compared with 0.4% of those whose main language was English or Welsh: suggesting the questions were simply misunderstood.

What’s worth £99.2bn a year according to one trusted source and £147bn to another? The UK grocery market. Some sources rely on EPoS (electronic point of sale) data – every transaction a retailer has made – but Aldi and Lidl famously don’t share this data, leaving out a huge chunk of the market. Others rely on consumers scanning barcodes of items they’ve bought, but this only covers products that are brought home after purchase and excludes products consumed outside the home after purchase.

The UK has seen a steep rise in worklessness due to long-term sickness, but what does this really tell us? In fact it says more about the benefit system than public health. Health problems aren’t actually becoming more common, but health-related payments have become more generous than unemployment benefits; making it more attractive for the workless to cite health as a reason for not having a job.

Does the UK public want to change the voting age? Well, it depends on the wording. 52% support giving 16 and 17 year olds the right to vote, but only 37% support reducing the voting age from 18 to 16.

58% of (white) Americans say they are spending too much on welfare vs too little (15%), yet 56% think they are spending too little on assistance to the poor (vs 16% too much). The difference? Welfare is a heavily loaded term.

1) Increase spend from $178 billion to $250 billion over six years
2) Increase spend by 6.4% a year, every year, for six years
3) Increase spend from $4,700 per person per year to $6,200 per person per year
Mathematically they’re all the same, but when pollster Frank Luntz tested them the third option was by far the most popular – people want to understand the individual benefit from government policies.